The interactive map displays the selected lake with two overlaid images representing lake depth at
different water levels. The left image always shows the lake at full pool (no drawdown), while the right
image changes with the selected drawdown level.
Use the drawdown slider to change the water level and compare changes in shoreline, surface area, and
depth zones. The map’s zoom and position remain constant for accurate side-by-side comparison.
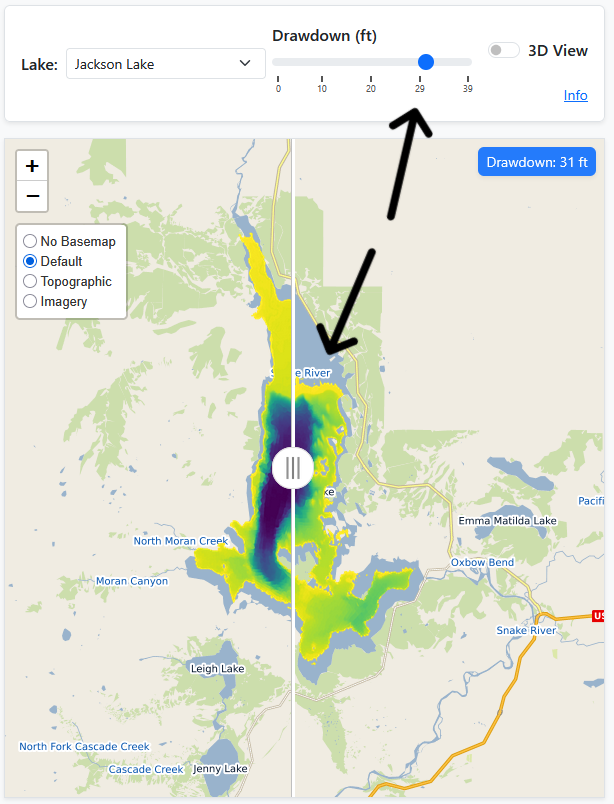
Drag the vertical comparison slider on the image to reveal differences between full pool and the
selected drawdown. The statistics table and chart to the right updates automatically to show habitat and
volume metrics
for the current depth.